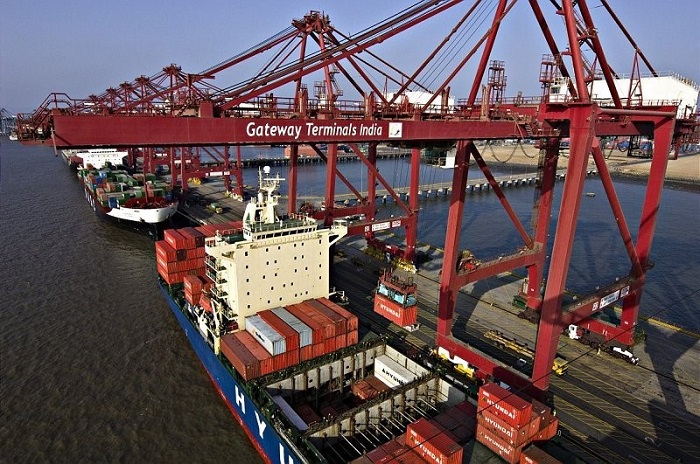
Container freight rates for Indian exporters have experienced a dramatic roller-coaster ride this year. Triggered by persistent geopolitical disruptions, the container freight rates surge India exporters 2026 experienced a staggering 130% spike between February and mid-October. However, recent market assessments point toward a cooling trend, giving businesses a crucial window to recalibrate their logistics strategies.
According to the Jefferies October 2026 report, global container benchmarks climbed from approximately US$2,000 to US$2,500 per FEU in February to a peak of roughly US$4,000 to US$4,500 by October, heavily driven by escalating tensions across West Asia and subsequent vessel re-routings around the Cape of Good Hope. Yet, as November unfolds, the momentum has begun to stall. Drewry’s World Container Index logged a composite rate of US$4,485 per 40ft container on October 15, before retreating by 3% to US$4,429 in the latest assessment as of November 4.
This article delivers an in-depth analysis of the shifting logistics landscape for Indian manufacturing exporters and global B2B buyers. We examine the exact pricing trajectory across major trade lanes, analyze carrier dynamics heading into the final quarter of the year, and provide an actionable playbook for optimizing supply chain costs on Today Adviser.
The Anatomy of the 2026 Freight Rate Surge
To understand where logistics costs are heading, we must examine how the market evolved over the first three quarters of 2026. The year began in a relatively stable state, with global container freight hovering between US$2,000 and US$2,500 per 40ft equivalent unit (FEU). Supply chains had largely digested the operational impacts of previous maritime crises, and capacity was relatively well-balanced against modest post-holiday demand.
However, compounding geopolitical flashpoints in West Asia severely altered vessel deployment schedules. Shipping lines were forced to reroute container vessels away from the Suez Canal and around the African continent via the Cape of Good Hope. This diversion added anywhere from 10 to 14 days to standard transit times between Indian ports and European or Mediterranean destinations, permanently soaking up effective global vessel capacity.
By mid-October 2026, the cumulative impact of extended transit times, bunker fuel cost inflation, and equipment repositioning imbalances drove rates up by roughly 130%. Indian exporters shipping to Western markets found themselves grappling with erratic sailing schedules, space shortages, and skyrocketing freight invoices that threatened to erase profit margins on low-margin bulk and semi-processed goods.
Current Market Corrections: The November 2026 Turning Point
Fortunately, the relentless upward trajectory has officially hit a ceiling. Recent data from the Drewry World Container Index illustrates a clear softening trend. After peaking mid-month at US$4,485, the composite index fell 3% to US$4,429 per 40ft box in the assessment ending November 4, 2026.
A closer look at major sub-routes reveals where the downward pressure is concentrated:
- Shanghai to Los Angeles: Decreased by 6% to US$7,514 per FEU.
- Shanghai to New York: Dropped by 5% to US$9,631 per FEU.
- Shanghai to Rotterdam: Inched up marginally by 1% to US$3,686 per FEU.
- Shanghai to Genoa: Remained essentially flat at US$4,151 per FEU.
For Indian exporters, these trans-Pacific and trans-Atlantic corrections signal broader market cooling. Furthermore, major container carriers announced generalized rate increases (FAK hikes) effective November 1, 2026. However, industry analysts widely judge these attempts as unlikely to stick in the physical market due to softening underlying global demand.
Demand Softening and Indian Trade Resilience
Demand-side indicators reinforce the narrative of a cooling market. According to National Retail Federation (NRF) data cited by Drewry, United States import volumes are forecast to drop by a significant 11% month-on-month in November as retailers pull back on inventory replenishment following early peak-season shipments.
Despite this global cooling trend, India’s domestic export engine continues to display remarkable resilience. India’s containerisable trade registered a robust 23% year-on-year growth rate in September. This divergence between local export momentum and softening global freight rates creates a unique tactical advantage for Indian suppliers who know how to negotiate effectively.
Route-by-Route Freight Cost Comparison
| Trade Lane / Route | February 2026 Indicative Rate (Per FEU) | Mid-October 2026 Peak (Per FEU) | Early November 2026 Assessment | Market Direction (Nov 2026) |
|---|---|---|---|---|
| Global Composite Index | US$2,000 – US$2,500 | US$4,000 – US$4,500 | US$4,429 (Drewry Index) | Softening / Easing |
| Asia to US West Coast | US$3,200 | US$8,000+ | US$7,514 | Down 6% from peak |
| Asia to US East Coast | US$4,100 | US$10,100+ | US$9,631 | Down 5% from peak |
| Asia to Northern Europe | US$2,100 | US$3,600 | US$3,686 | Stable / Flat |
| India to West Asia / Europe | US$1,800 | US$4,200 | US$3,900 (Indicative) | Easing off peak |
Actionable Tactics for Indian Exporters and B2B Buyers
As rates ease from their frantic mid-October peaks, complacency is the greatest risk for supply chain managers. Exporters must implement structured operational and contractual adjustments to lock in savings and protect against future volatility.
1. Tighten Rate Validity Windows
During the height of the container freight rates surge India exporters 2026 experienced, carriers and forwarders routinely issued quotes valid for as little as 24 to 48 hours. This extreme volatility forced exporters to make rushed pricing decisions for their international buyers.
Now that the market is stabilizing, push back against ultra-short validity terms. Demand rate validity windows of at least 7 to 14 days from freight forwarders. This gives your sales and quotation teams adequate breathing room to lock in orders with global B2B buyers without absorbing unexpected spot-market spikes.
2. Strategic Cargo Consolidation
When freight rates spike, shipping smaller, fragmented consignments becomes cost-prohibitive. Indian exporters must prioritize cargo consolidation strategies:
- Multi-Supplier Pooling: Combine shipments from multiple manufacturing units within the same industrial cluster (e.g., Tiruppur for textiles, Moradabad for handicrafts, or Ludhiana for light engineering) into consolidated Full Container Loads (FCL).
- Hub Warehousing: Utilize bonded or non-bonded consolidation hubs near major gateway ports like Nhava Sheva (JNPT), Mundra, or Chennai to aggregate LCL shipments into cost-effective FCL containers.
3. Tactical FCL and LCL Switching
Evaluate your shipment sizing dynamically. When FCL rates were doubling, some low-volume exporters panicked and shifted entirely to Less than Container Load (LCL). However, LCL handling fees, destination deconsolidation charges, and prolonged transit times often negate the initial savings.
With rates easing, run a comparative cost analysis for every batch:
- If your consignment volume exceeds 15 CBM, negotiate direct FCL carrier rates rather than splitting into LCL.
- If volume hovers between 5 and 12 CBM, explore buyer-consolidation programs on verified B2B platforms like Today Adviser to share container space securely.
4. Contract vs. Spot Market Optimization
Should you lock into long-term service contracts (SCs) or ride the spot market? The current transition phase demands a hybrid procurement model:
- Core Volume on Contract: Lock 50% to 60% of your predictable, recurring export volume under 6-month fixed-rate contracts with tier-one carriers or reliable non-vessel operating common carriers (NVOCCs).
- Flex Volume on Spot: Leave the remaining 40% exposed to the spot market to capture further downward rate corrections as global demand softens through November and December.
5. Scrutinize Surcharge Clauses
Carrier invoices often conceal the true cost of shipping behind a wall of auxiliary fees. During negotiations, review and challenge the following clauses:
- Emergency Risk Surcharges (ERS) / Peak Season Surcharges (PSS): With rates easing, resist any newly introduced PSS from carriers, especially given the 11% forecast drop in US import volumes.
- Terminal Handling Charges (THC): Ensure origin and destination THC adjustments are clearly capped within your service agreement.
- Currency Adjustment Factors (CAF): Tie CAF calculations transparently to official RBI or central bank exchange rate indices.
6. The Suez-Return Watch Factor
The single biggest variable for 2027 logistics planning is the potential resumption of Red Sea transits. If geopolitical negotiations successfully restore safe passage through the Suez Canal, global container capacity will instantly expand by an estimated 7% to 10% as vessels resume shorter transit routes.
Exporters must maintain an agile logistics framework. Do not lock yourself into rigid, long-term high-rate contracts that prevent you from benefiting from a sudden capacity flood should the Suez route reopen.
Common Mistakes to Avoid
- Failing to Verify Forwarder Credentials: Working with unverified freight intermediaries offering predatory low rates can result in hidden destination fees, cargo abandonment, or rolling of bookings.
- Ignoring Documentation Compliance: Discrepancies in Bills of Lading or Certificate of Origin papers during volatile rate periods can lead to demurrage and detention charges that quickly exceed the freight cost itself.
- Over-Reliance on Single-Carrier Allocations: Diversify your carrier portfolio across at least two distinct shipping alliances to mitigate space allocation cuts and sudden equipment shortages.
Frequently Asked Questions
What caused the massive container freight rate surge between February and October 2026?
The surge was primarily driven by ongoing security disruptions in West Asia, which forced shipping lines to divert vessels around Africa's Cape of Good Hope. This added 10 to 14 days to transit times, effectively absorbing global vessel capacity, tightening equipment availability, and pushing operating costs higher.
Are container freight rates currently dropping in November 2026?
Yes. Following a peak in mid-October where global benchmarks reached US$4,000–$4,500 per FEU, rates have begun easing. Drewry’s World Container Index dropped 3% to US$4,429 per 40ft container in early November, signaling a cooling trend driven by softening global demand.
How are Indian exporters impacted by current global shipping trends?
While global demand is softening—such as an 11% projected drop in US November imports—India’s containerisable trade grew 23% year-on-year in September. This resilient local export volume, combined with easing global freight rates, gives Indian suppliers strong leverage to negotiate better logistics terms.
Should Indian exporters sign long-term freight contracts right now?
Exporters should adopt a hybrid procurement strategy. Secure 50% to 60% of predictable volume on short-to-medium contracts, while leaving the rest exposed to the spot market to capture further rate corrections as carriers struggle to enforce November FAK hikes.
What is the best way to reduce ocean freight costs for SMEs?
SMEs should focus on cargo consolidation by pooling shipments with neighboring manufacturers in industrial clusters, optimizing FCL versus LCL thresholds, and utilizing verified B2B trade platforms to source transparent, competitive freight quotes.
What is the 'Suez-Return Watch Factor' and why does it matter?
It refers to the potential normalization of shipping lanes through the Red Sea and Suez Canal. If reopened, it will instantly inject significant vessel capacity back into the market, likely driving freight rates down further as transit times normalize.
How can I verify reliable shipping rates and find trusted suppliers?
Always cross-reference indicative market benchmarks with certified forwarders. To connect with verified global buyers, exporters, and logistics partners, utilize professional B2B marketplaces like Today Adviser to post requirements and secure transparent trade partnerships.
Conclusion and Next Steps
The container freight rate roller-coaster of 2026 highlights the critical need for agility in international trade. While the sharp 130% spike from February to mid-October tested the resilience of Indian exporters, the cooling trend observed in November provides a welcome reprieve to renegotiate contracts, optimize container loads, and protect profit margins.
To stay ahead of shifting logistics dynamics and connect with verified international partners, do not leave your supply chain to chance. Post your trade requirements, compare vetted logistics solutions, and connect with verified suppliers and exporters directly on Today Adviser today.